dotTrace
The latest dotTrace brings a completely new profiling Timeline mode, redesigned dotTrace Home window, more flexible subsystems, a refined UI, performance viewer enhancements, integration with ReSharper 9, and more.
All .NET tools from JetBrains including dotTrace are now delivered with a new common platform to conserve memory usage and optimize performance.
This completely new way profiling method is perfect for analyzing UI freezes, sync delays, excessive garbage collections, file I/O, and other interval events.
Timeline profiling collects temporal call stack and thread state data about your application, as well as temporal data about memory allocation, garbage collections, and I/O operations. Analyze Time data, Memory Allocation data, or data about raised Exceptions in your app. Learn more »
Experience the most flexible way to profile .NET apps, ever.
Slice and dice data using filters, the call tree, or diagrams. In addition to activating a specific filter, each control is constantly updated with up-to-date filtered information from other controls.
Combine powerful filters to analyze virtually any aspect of your app. Learn more »

Use filters in any combination to slice and dice your profiling data. Four available filter types let you configure subject analysis, thread state, blocking GC and interval filters. After filters are applied, a set of time intervals or point events are created based on a specific condition, also reflected by other components.
Any data you select via filters or the call tree are highlighted on Timeline diagrams.
In Timeline profiling, each diagram is more than just a display. You can select any time interval you want to investigate directly on the diagram. Once you do, all the other controls are instantly recalculated, letting you browse profiling data from multiple sides.
For your convenience there are specific diagrams visualizing blocking GC, UI freezes, threads states, as well as CPU utilization.
The new Home screen will make you feel right at home in dotTrace. From here, you can start a new local or remote profiling session for known .NET application types, attach to a running process, configure a session, or open snapshots collected during recent sessions. Every application type will offer different settings for running the application you want to profile. Select the Advanced checkbox to get additional options such as using the profiler API.
If you're new to performance profiling, check out the Tutorials section on the Home screen. Use the redesigned online help system for guidance on how dotTrace works and how to analyze collected data.

With the redesigned profiling controller, you can start profiling, generate a snapshot, tell the profiler to continue capturing data or stop right there, detach the profiler, or kill the running process.
One notable enhancement is that you can expand the profiling controller for a 'sneak peek' into the real-time CPU and memory usage of your application.
If your application includes multiple running processes, you can choose to profile any number of them from the Processes page.
Now you can choose in one click whether you want to immediately start collecting further profiling data or get a snapshot and wait.

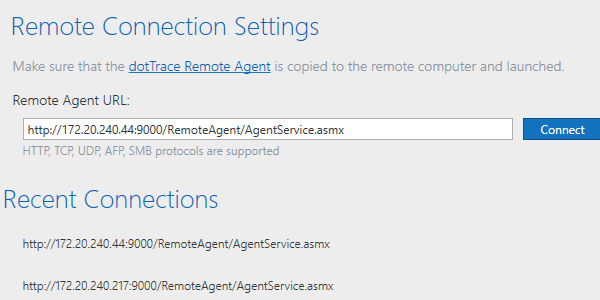
Remote profiling, just as many other components in dotTrace 6, has benefitted from a refreshed UI.
Enjoy the new profiling experience remotely via HTTP, TCP, UDP, or any other supported protocol.

When analyzing profiling results, we get a broad overview of subsystems used by our application. This gives us a rough idea of where most time is spent: in the UI, in user code, with Garbage Collection, with I/O, or custom subsystems.
Now more flexibility is available here. Select "Join" in subsystems options to calculate a subsystem's time within the calling subsystems. The subsystem will be shown separately only in case there are no subsystems to join with. Select "Hide" to exclude a subsystem from current calculations.
Snapshot overview now includes Runtime chart that shows application CPU activity and memory consumption during profiling. Double arrow lines show timeframes when performance data were collected.

Starting with dotTrace 6, we offer a single installer for all JetBrains .NET tools including ReSharper, dotTrace, dotMemory, dotCover and dotPeek. You will be able to choose which products you want to install and let the installer do the rest.
All these tools will operate on a shared platform, which conserves resources when several products are running at the same time.

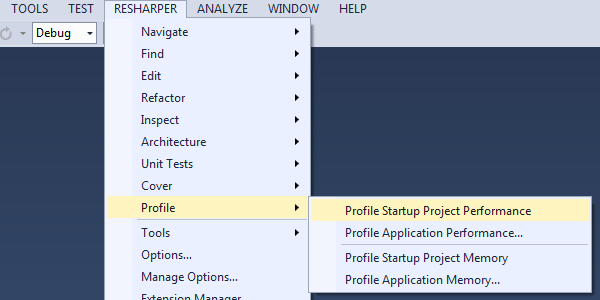
You can easily start profiling unit tests from Visual Studio code editor, Solution Explorer or ReSharper's unit tests runner. dotTrace 6 delivers ReSharper 9 support. Moreover, now you have all new platform tools functionality in one place: dotTrace actions are available in Visual Studio from 'ReSharper' menu item.
dotTrace 6 adds integration with Visual Studio 2015 Preview. You can launch profiling sessions from within Visual Studio 2015 Preview and navigate from a snapshot to the corresponding source code in the latest version of the Microsoft IDE.
Visual Studio 2010, 2012 and 2013 are still supported, too.